Z-Score Table: A Comprehensive Guide
Z-score tables are essential tools in statistics. They help us interpret data and make informed decisions. This guide will explain the concept of Z-scores, their importance, and how to use them effectively.
Key Takeaways
- Z-scores measure how many standard deviations a data point is from the mean.
- Z-Score tables help convert Z-Scores to probabilities and percentiles.
- Understanding Z-Score tables is crucial for statistical analysis and interpretation.
- Proper interpretation of Z-Score tables can lead to more accurate decision-making.
What is a Z-Score?
A Z-Score, also known as a standard score, is a statistical measure that quantifies how many standard deviations a data point is from the mean of a distribution. It allows us to compare values from different datasets or distributions by standardizing them to a common scale.
Calculating Z-Scores
To calculate a Z-Score, use the following formula:
Z = (X – μ) / σ
Where:
- X is the raw score
- μ (mu) is the population mean
- σ (sigma) is the population standard deviation
For example, if a student scores 75 on a test with a mean of 70 and a standard deviation of 5, their Z-Score would be:
Z = (75 – 70) / 5 = 1
This means the student’s score is one standard deviation above the mean.
Interpreting Z-Scores
Z-Scores typically range from -3 to +3, with:
- 0 indicating the score is equal to the mean
- Positive values indicating scores above the mean
- Negative values indicating scores below the mean
The further a Z-Score is from 0, the more unusual the data point is relative to the distribution.
Understanding Z-Score Tables
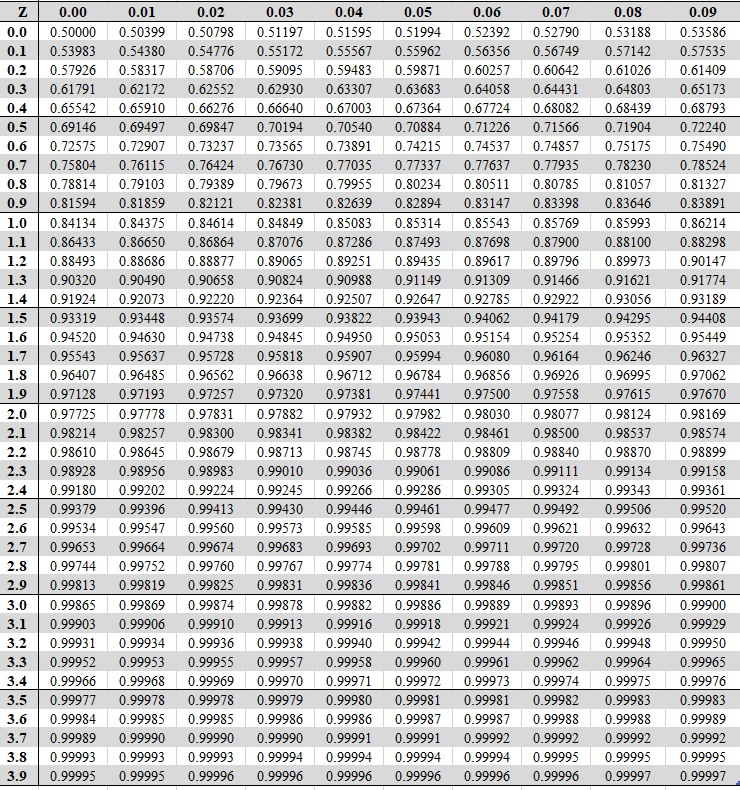
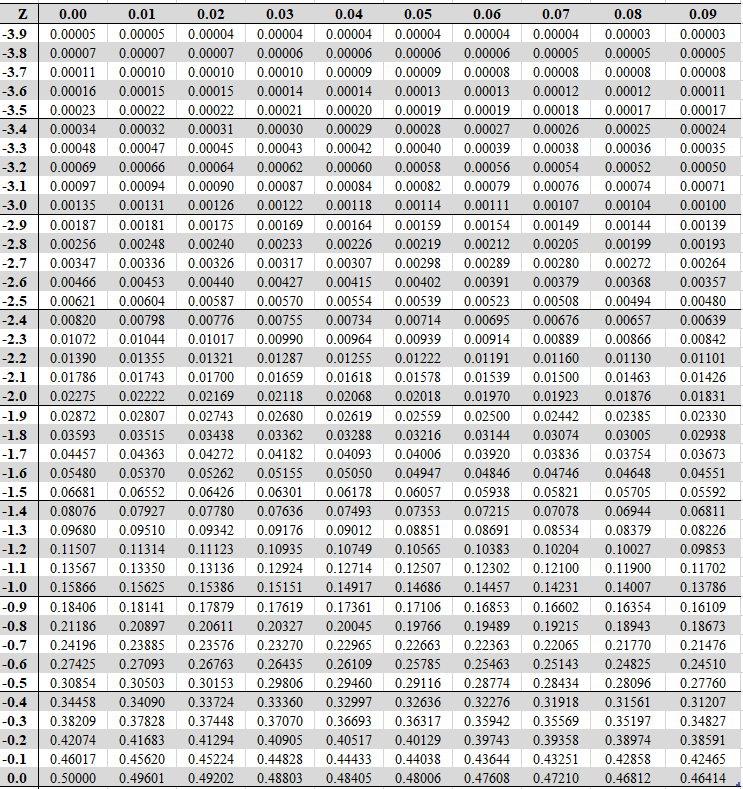
Z-Score tables are tools that help convert Z-Scores into probabilities or percentiles within a standard normal distribution. They’re essential for various statistical analyses and decision-making processes.
Purpose of Z-Score Tables
Z-Score tables serve several purposes:
- Convert Z-Scores to probabilities
- Determine percentiles for given Z-Scores
- Find critical values for hypothesis testing
- Calculate confidence intervals
Structure of a Z-Score Table
A typical Z-Score table consists of:
- Rows representing the tenths and hundredths of a Z-Score
- Columns representing the thousandths of a Z-Score
- Body cells containing probabilities or areas under the standard normal curve
Positive Z-score Table

Negative Z-Score Table

How to Read a Z-Score Table
To use a Z-Score table:
- Locate the row corresponding to the first two digits of your Z-Score
- Find the column matching the third digit of your Z-Score
- The intersection gives you the probability or area under the curve
For example, to find the probability for a Z-Score of 1.23:
- Locate row 1.2
- Find column 0.03
- Read the value at the intersection
Applications of Z-Score Tables
Z-Score tables have wide-ranging applications across various fields:
In Statistics
In statistical analysis, Z-Score tables are used for:
- Hypothesis testing
- Calculating confidence intervals
- Determining statistical significance
For instance, in hypothesis testing, Z-Score tables help find critical values that determine whether to reject or fail to reject the null hypothesis.
In Finance
Financial analysts use Z-Score tables for:
- Risk assessment
- Portfolio analysis
- Credit scoring models
The Altman Z-Score, developed by Edward Altman in 1968, uses Z-Scores to predict the likelihood of a company going bankrupt within two years.
In Education
Educators and researchers utilize Z-Score tables for:
- Standardized test score interpretation
- Comparing student performance across different tests
- Developing grading curves
For example, the SAT and ACT use Z-scores to standardize and compare student performance across different test administrations.
In Psychology
Psychologists employ Z-Score tables in:
- Interpreting psychological test results
- Assessing the rarity of certain behaviours or traits
- Conducting research on human behavior and cognition
The Intelligence Quotient (IQ) scale is based on Z-Scores, with an IQ of 100 representing the mean and each 15-point deviation corresponding to one standard deviation.
Advantages and Limitations of Z-Score Tables
Benefits of Using Z-Score Tables
Z-Score tables offer several advantages:
- Standardization of data from different distributions
- Easy comparison of values across datasets
- Quick probability and percentile calculations
- Applicability to various fields and disciplines
Limitations and Considerations
However, Z-Score tables have some limitations:
- Assume a normal distribution, which may not always be the case
- Limited to two-tailed probabilities in most cases
- Require interpolation for Z-Scores not directly listed in the table
- Maybe less precise than computer-generated calculations
Practical Examples of Using Z-Score Tables
To better understand how Z-Score tables work in practice, let’s explore some real-world examples:
Example 1: Test Scores
Suppose a class of students takes a standardized test with a mean score of 500 and a standard deviation of 100. A student scores 650. What percentile does this student fall into?
- Calculate the Z-Score: Z = (650 – 500) / 100 = 1.5
- Using the Z-Score table, find the area for Z = 1.5
- The table shows 0.9332, meaning the student scored better than 93.32% of test-takers
Example 2: Quality Control
A manufacturing process produces bolts with a mean length of 10 cm and a standard deviation of 0.2 cm. The company considers bolts acceptable if they are within 2 standard deviations of the mean. What range of lengths is acceptable?
- Calculate Z-Scores for ±2 standard deviations: Z = ±2
- Use the formula: X = μ + (Z * σ)
- Lower limit: 10 + (-2 * 0.2) = 9.6 cm
- Upper limit: 10 + (2 * 0.2) = 10.4 cm
Therefore, bolts between 9.6 cm and 10.4 cm are considered acceptable.
Advanced Concepts Related to Z-Scores
The Empirical Rule
The Empirical Rule, also known as the 68-95-99.7 rule, is closely related to Z-Scores and normal distributions:
- Approximately 68% of data falls within 1 standard deviation of the mean (Z-Score between -1 and 1)
- Approximately 95% of data falls within 2 standard deviations of the mean (Z-Score between -2 and 2)
- Approximately 99.7% of data fall within 3 standard deviations of the mean (Z-Score between -3 and 3)
This rule is beneficial for quick estimations and understanding the spread of data in a normal distribution.
FAQs
What’s the difference between a Z-Score and a T-Score?
Z-scores are used when the population standard deviation is known, while T-scores are used when working with sample data and the population standard deviation is unknown. T-scores also account for smaller sample sizes.
Can Z-scores be used for non-normal distributions?
While Z-scores are most commonly used with normal distributions, they can be calculated for any distribution. However, their interpretation may not be as straightforward for non-normal distributions.
How accurate are Z-Score tables compared to computer calculations?
Z-Score tables typically provide accuracy to three or four decimal places, which is sufficient for most applications. Computer calculations can offer greater precision but may not always be necessary.
What does a negative Z-Score mean?
A negative Z-Score indicates that the data point is below the mean of the distribution. The magnitude of the negative value shows how many standard deviations are below the mean point.
How can I calculate Z-Scores in Excel?
Excel provides the STANDARDIZE function for calculating Z-Scores. The syntax is: =STANDARDIZE(x, mean, standard_dev)
Are there any limitations to using Z-Scores?
Z-Scores assume a normal distribution and can be sensitive to outliers. They also don’t provide information about the shape of the distribution beyond the mean and standard deviation.

